Introduction
It is the 120th minute of a World Cup quarter final. The game is evenly poised and it looks like it is headed to a penalty shootout. Ghana has a free kick deep into Uruguay territory. John Pantsil takes the free kick and puts the ball into the box. The ball ricochets off several players, falling to Dominic Adiyiah to head into an almost empty net. But Luis Suárez is on the goal line to swat it away with his hands. This earns him a red card, yet the advantage is still with Ghana. However, with this act, Suárez reduced the chance of a goal from 100% to 78%. Asamoah Gyan went on to miss the ensuing penalty and Uruguay won the game in the penalty shootout.
Suárez’s case is an extreme one. We may never see a situation like this again. However, the underlying calculation isn’t unique to him in the wider strategic context of football. We routinely see strikers clean through on goal and the defender facing a choice: bring the striker down and take a red card, or allow a high percentage shot at goal and trust the team to recover in the remaining minutes. In this post, we examine this very dynamic, and attempt to answer the question: when is it worth taking a red card to preserve a result?
How often do we see a red card?
For our analysis, we use data from the top five European leagues from the 2010/11 season through to the current season.
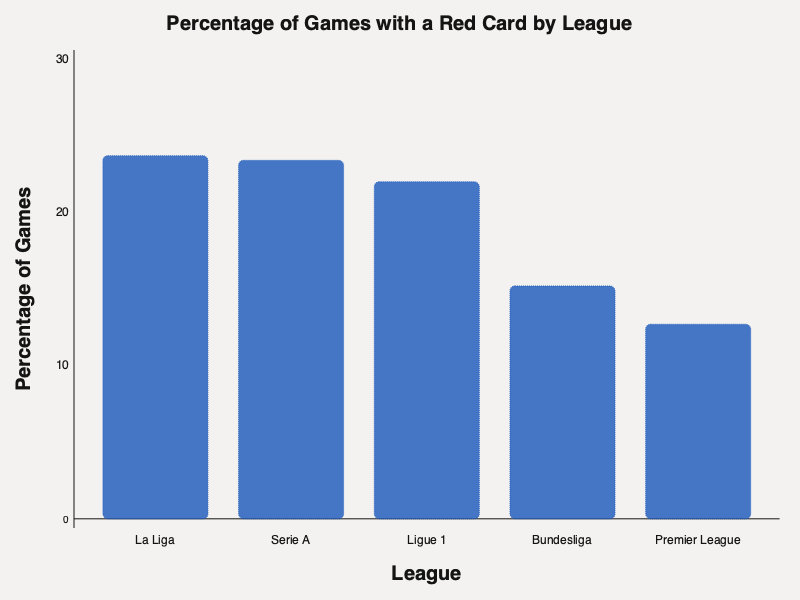
We see that about 20% of games have at least one red card. Going through the individual leagues, the Premier League surprisingly has the lowest percentage of games with a red card. For a league that is considered to be one of the most physical leagues in the world, this could be seen as a surprising result. But perhaps this could be explained by the high barrier for a red card allowing the league to be more physical. Meanwhile, the “more technical” leagues can be found on the other side of the spectrum, with them seeing almost twice as many games with red cards compared to the Premier league.
When do we see a red card?
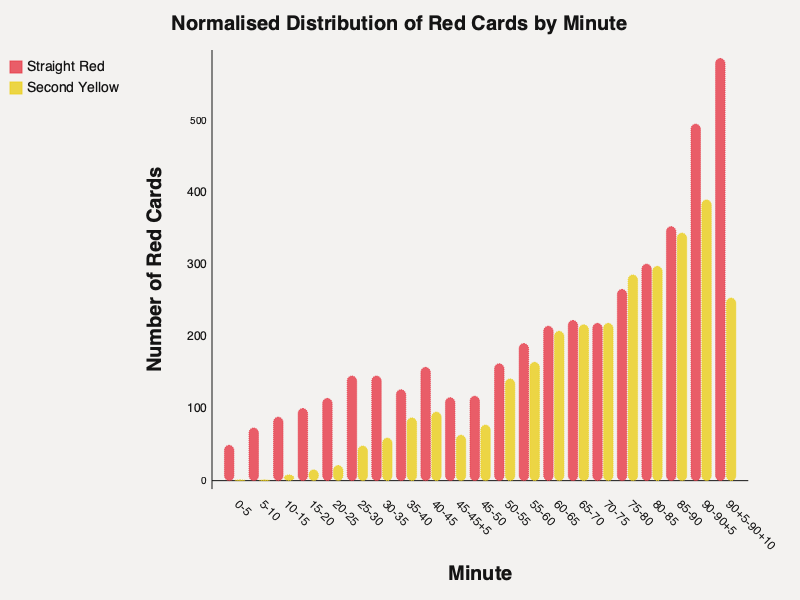
In plotting the distribution of red cards with respect to time, we thought it made sense to distinguish between straight reds and second yellows since they are two separate phenomena. We see an increase in the number of both as the game progresses. To account for the fact that few games go beyond 5 minutes of second half stoppage time, we normalised the number of cards by the fraction of games that reach that point in time.
Returning to the increase in second yellows, this can be explained by the fact that a second yellow requires a first yellow. As the game goes on, the number of eligible candidates for a second yellow also increases. Straight reds carry no such constraint. A player can receive one in the first minute as easily as the ninetieth. And yet we see roughly twice as many straight reds in the second half as in the first, with their numbers peaking towards the end of the game. This could be because referees are reluctant to show red cards early so as not to spoil the game, or because of player fatigue and rising frustration leading to rash decisions.
Effect of the red card on the game
To understand the effect a red card has on a game, it is important to view it from the context of the game state before the red card. We also made the decision to restrict ourselves to those games that only had one red card to simplify the analysis.
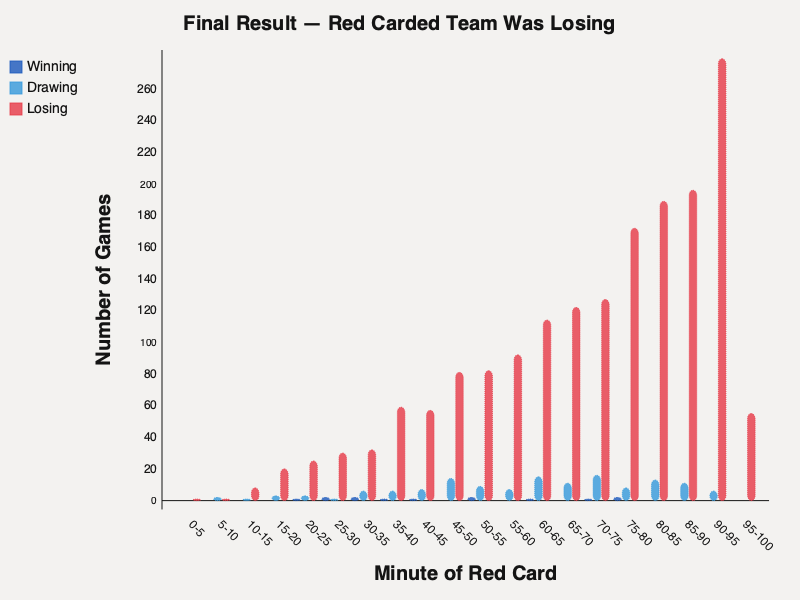
Losing game state
In this scenario, the team that received the red card was already losing at the time the red card event happened. Unsurprisingly, it is overwhelmingly likely at any point in time that the red carded team will lose the game. Only about 8% of teams that were losing when they got the red card came back to earn a draw or win.
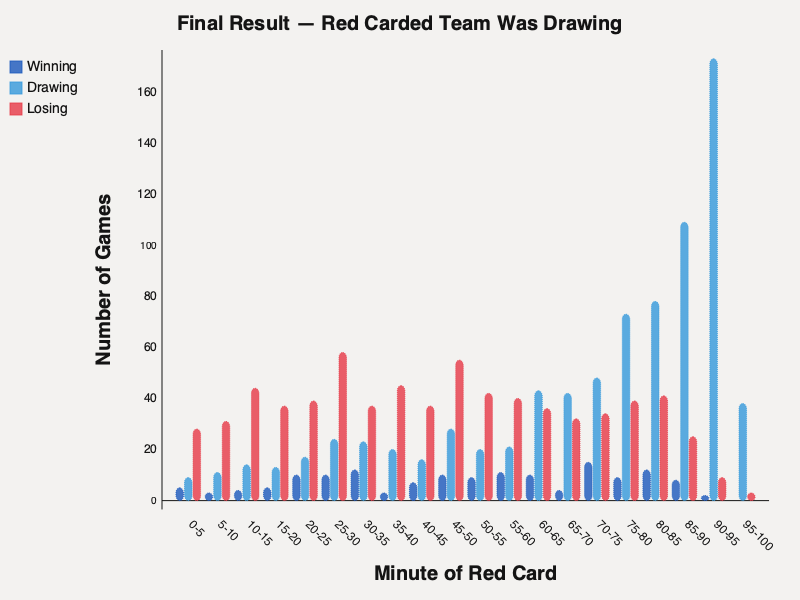
Drawing game state
In this scenario, the game was level at the time of the red card. We see that up until the 60–65th minute, it is more likely that the red carded team will lose the game than hold the draw or snatch a victory. The likelihood of holding the draw only continues to increase from that point going forward. Interestingly, we almost never see any wins for the team with ten men in second half stoppage time. This probably indicates that at this point teams are content with holding the result, and don’t want to spend any resources chasing an unlikely win.
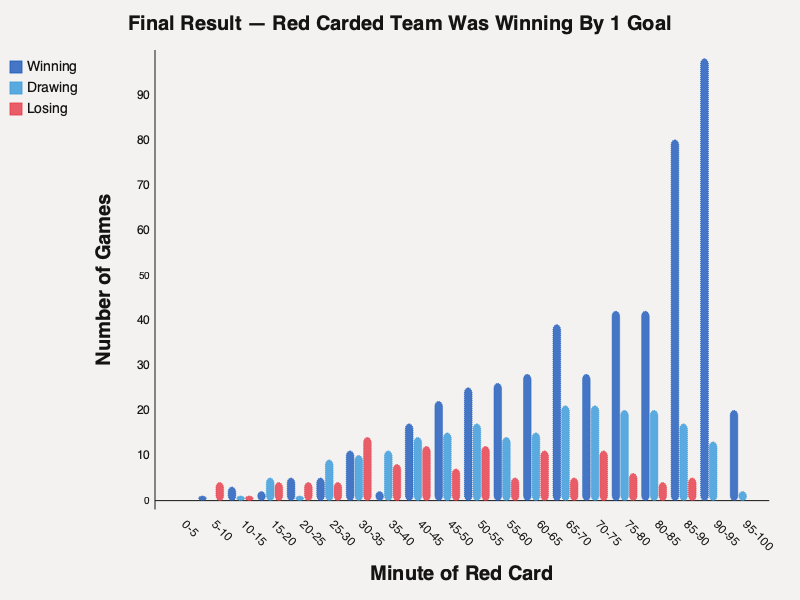
Winning by one goal game state
For the winning game state, we thought it would be more interesting to restrict the analysis to a situation where the red carded team was winning by one goal. Interestingly, unless the red card were to occur before the starting phase of the second half, it is very unlikely to see the team with the man advantage to go on to win the game. Strikingly, in our entire dataset, there are only 9 occasions where a team that was leading by a goal and received a red card after the 80th minute went on to lose.
Putting it all together
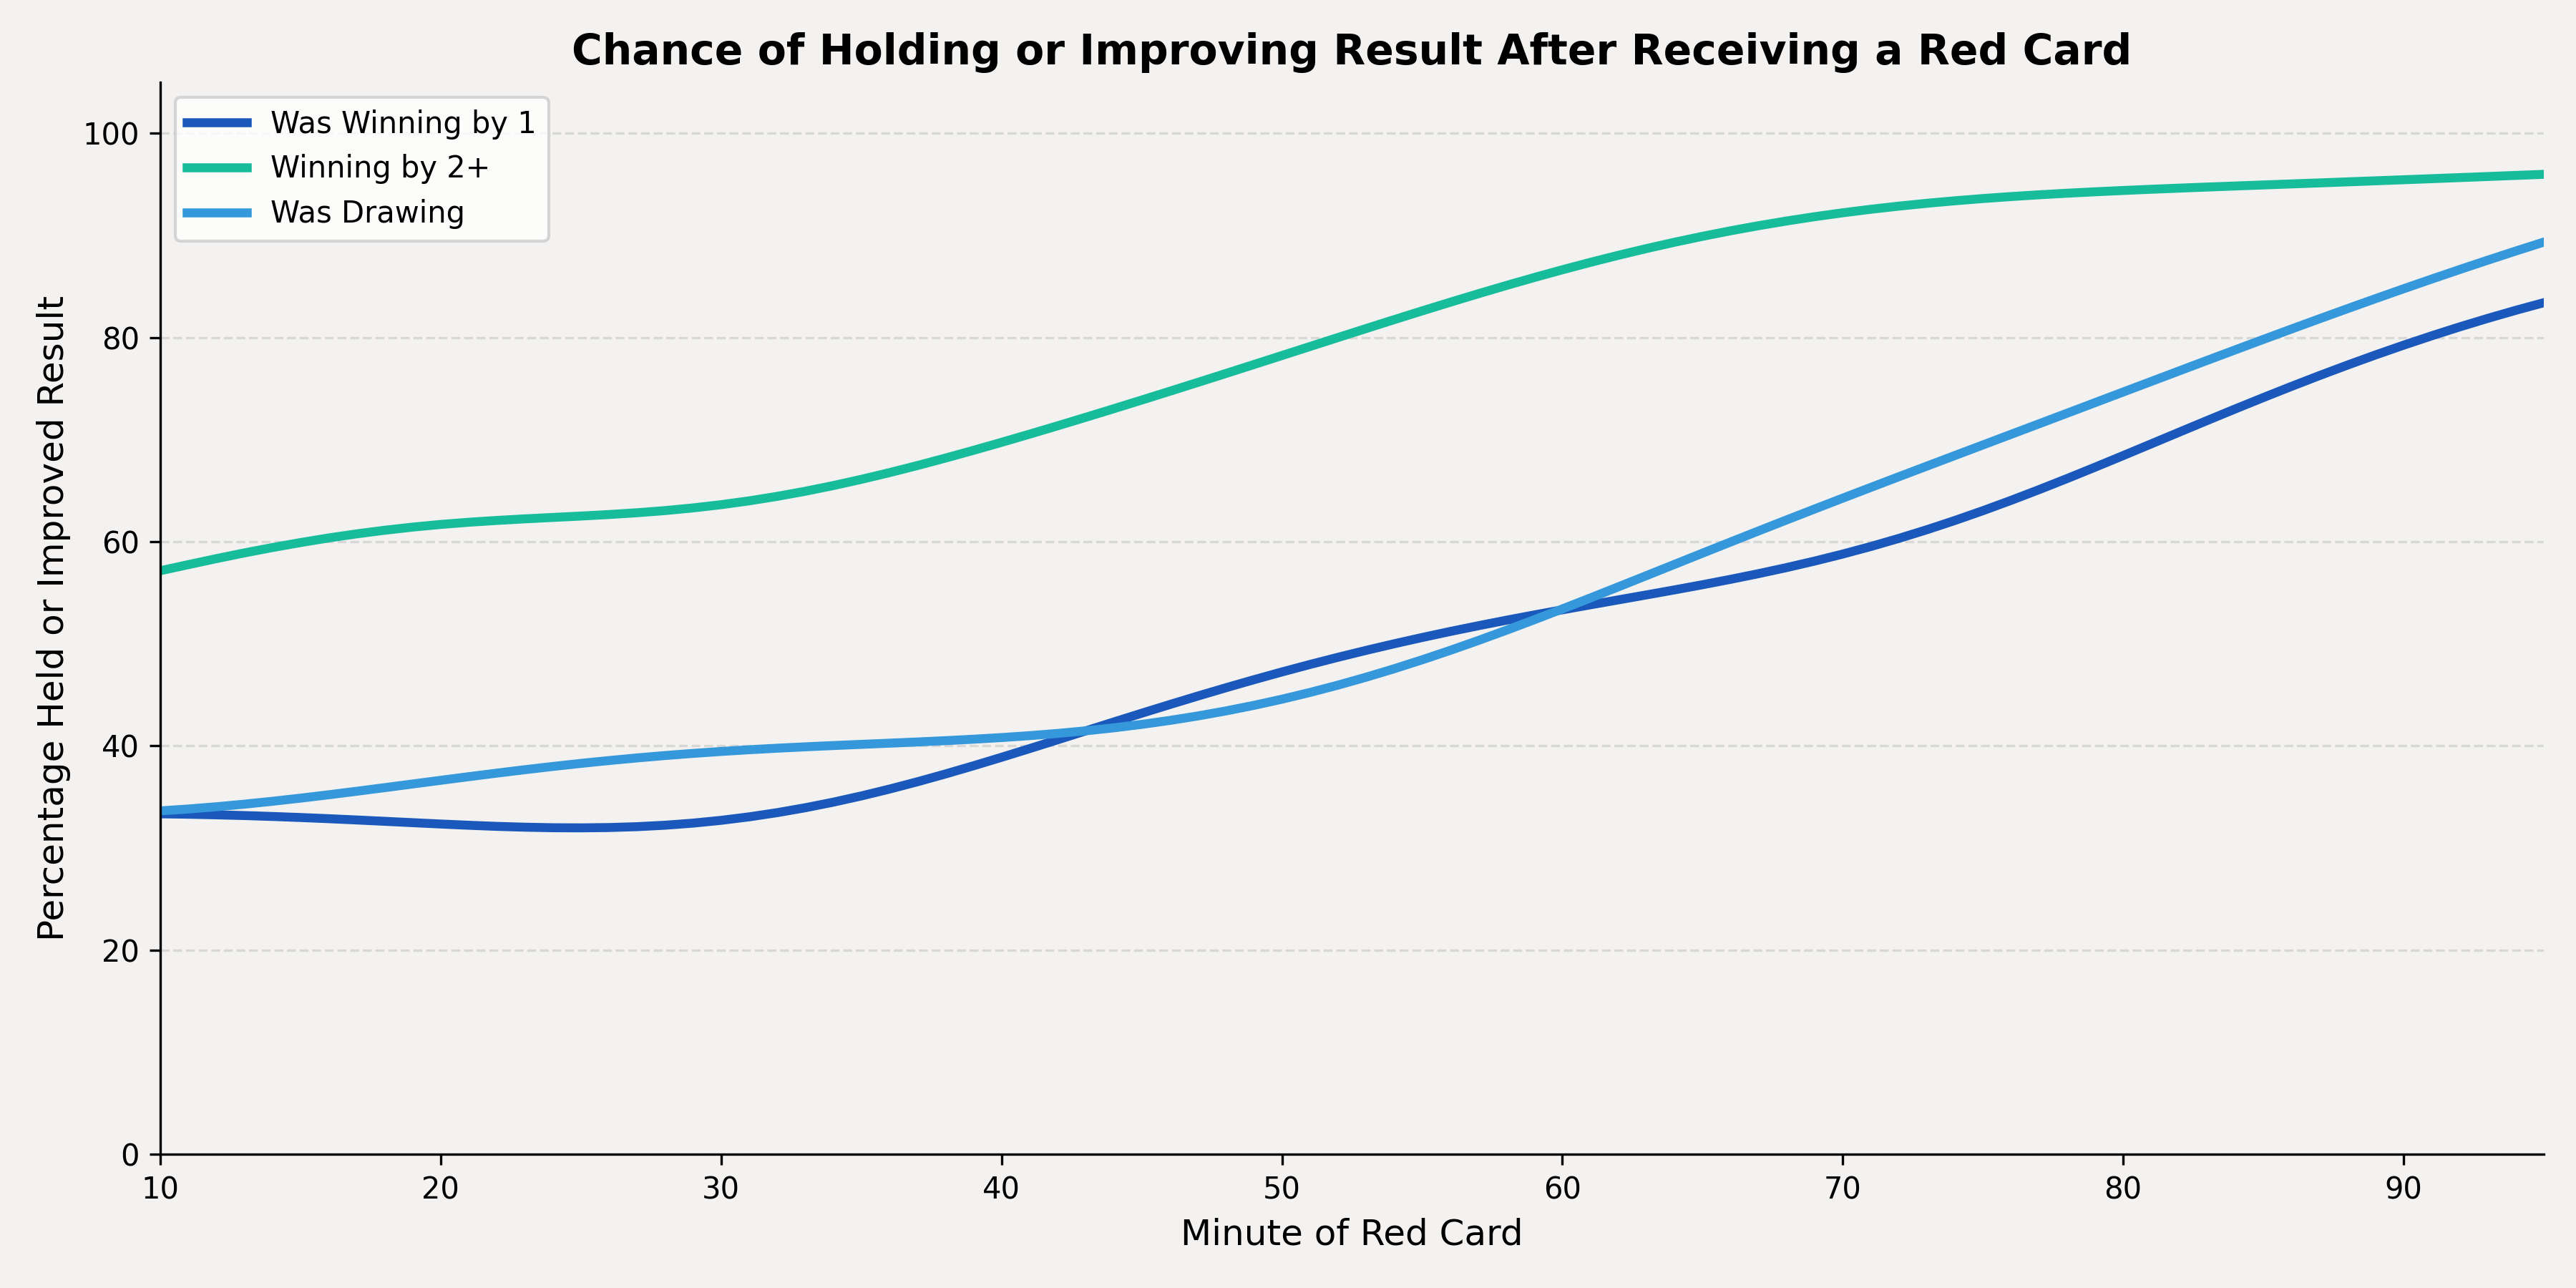
Plotting the chance of holding or improving a result against the minute of the red card gives us a single picture of the cost. Three patterns stand out.
A two-goal cushion is largely insulated from a red card. Even very early reds — minute ten or 15 — leave the carded team with a roughly 60% chance of holding the win. By the hour mark, that climbs above 80%. A two-goal lead, even down to ten men, is almost always enough.
The drawing and winning-by-one lines tell a different story. Until about the 40th minute, both sit between 30-40%: a red in the first hour while the game is on a knife's edge is genuinely costly. The two lines converge through the 60-70 minute window, and by the closing stages both rise sharply — a red card in the 85th minute when winning by one or drawing leaves the team with around an 80% chance of preserving the result.
The crossover point is the practical takeaway. Somewhere around the 60th minute, a red card stops being a likely loss of points and starts being a manageable (and statistically favourable) cost.
Conclusion
Returning to the question we opened with: when is it worth taking a red card to preserve a result?
The data gives a partial answer. If you're protecting a one-goal lead in the final ten minutes, the cost of a red card is small. Your team holds the result roughly 80% of the time. If the same situation comes up before the hour mark, you're making a much bigger bet that is most likely not going to pay off.
The defender will have to weigh these odds against the other side of the story that the data doesn’t tell. How good is the chance that they are denying? How good of a finisher is the striker? How much does he trust his goalkeeper in a one-on-one situation? Suárez's gamble worked because his trade was as clean as football gets. A certain goal denied, a penalty conceded with no time left for Uruguay to feel the cost of playing a man down. The rest of football operates in greyer territory. This level of data won't tell a defender whether to foul, but it can show them the predicted cost of their actions.